Shorter the format of Cricket, more role random events play in determining the course of the game, rather than the skills of the players. For instance, in T20 it does not matter if you are a regular bowler or just some part-timer. We do know the difference between Glen McGrath and Ashish Nehra, but that difference was brought out by longer versions of Cricket (Tests and ODI).
Sports are great equalizers, players come from different backgrounds, and are treated alike (process of mixing) to find out a new order in the players (process of re-ordering), which is skill based not background based. And the players in the new order emerge as the Heroes and inspirations to others. It is absolutely important for a game to perform the two processes and provide heroes to the public, and thus to remain an important activity in the public opinion.
But every game has its own dynamics and every game needs some minimum amount of time to do the process of mixing and re-ordering. If two people compete for a very short duration, there is no way to determine who is better.
Imagine if tennis matches were to last for only game, instead of there/five sets, would we have great tennis players such as Bjorn Borg, Jimmy Connors, Pete Sampras, Andre Aagasi, Boris Becker, Roger Fedrer, Martina Navratilova, Steffi Graf. In all likelihood the answer is no...
Same applies to Cricket, if a game were to last for one over each (just because its short and will attarct more audience) would soon fall out the public imagination as it will not be able to find out the best among the better player. We can do the statistics to see if the Twenty20 has produced any hero who was not already considered a great in the longer form of the game. In fact all the most successful players of the Twenty20 cricket are excellent players of the longer form of cricket.
If a game is reduced to some arbitrary short duration, it will not be able to do mixing and re-ordering. How can it do it, if the inherent randomness are stronger than the players influence. In Engineering we call such a situation as low signal-to-noise-ratio (SNR). If a game does not allow players sufficient time to really influence the course of the game, the game will be severely deprived of its heroes.
So in the shorter form of cricket (Twenty20) about which everyone (including the former players and administrators) so excited about, and suggesting that soon all forms of cricket be replaced by the 20 over format, in fact, is unlikely to produce Heroes and hence I conjecture would fall out of the public imagination.
It is possible a dis-interest in cricket triggered by the Twenty20 format, might bring back the longer forms of the game. However, Cricket is not an easy sports, it takes generation to develop a nurturing culture for Cricket. There is a reason why ICC is struggling to generate interest in traditionally non-cricket playing nations about Cricket.
So, in a more likely scenario current attraction with Twenty20 is in fact start of the eventual demise of Cricket. This time around there wont be any Ashes left this time around to play for.
Sunday, August 2, 2009
Saturday, August 1, 2009
How To Save Test Cricket: Teach the audience
After the success (mainly monetary, at least that what was told) of IPL, everyone in the cricket world is discussing the future of cricket. The shortest form of cricket has presented the biggest threat to the cricket in its purest form that is the Test Cricket. Kevin Pietersen thinks that Test cricket would be dead in about 10 years. Brian Lara is more pessimistic and said that the game of Cricket it self would be dead in next five decades or so. Most former players think that 50 Over cricket would suffer most and perhaps would be the first victim of Twenty20 cricket. Not that Cricket players are know for their gray matter but their statements can definitely sway the opinion and the game can go their predicted way.
The lack of spectators, even in the international matches (primarily in Tests and also in Limited overs) led to the advent of 20 Over games in international cricket. The administrators argued that even the 50 over match lasts too long (and gets boring) and the game is not compatible with the fast paced age we are living in. They thought that reducing the overs would bring back spectators to the stadiums. I think it did happen to some extent but results are far from the expectations.
Why test cricket is losing its appeal
But is it true that spectator do not turn up because the game is too long and the do not find time to watch the matches? I do not agree.
I can safely cite my own example. My academic interests required me to spend long hour on my study desk, in my school and college days. But I still found time to watch Test matches, at least read about those and discuss the progress of the matches, and of course cricket statistics. As the pace of my life increased the access to technology also increased. So now I work even more than I used to in my college days, but I watch more cricket. Technology has tremendously helped me in saving time and use that to watch cricket.
I think that in this fast paced life, supported by technology, everyone has more time at hands. So I think people do have time to follow cricket matches even the Test matches.
The real reason
In my opinion the main reason Test cricket is losing its appeal is because we do not have people who can understand Test cricket properly.
As the game became popular, media interest increased and with that came the sponsors. Who very rightly chose to focus on the important but rather rare events in the match that is 6's and 4's and also wickets to some extent. The younger generation that grew up watching cricket on TV, assumed that cricket has to be all about boundary shots. This started a kind of a viscous circle. Cricket administrators started to go for batting friendly wickets, took away effective weapons from the bowlers and shortened the boundaries, thus, sent the message that cricket indeed is about 6s and 4s.
A potential solution to make test cricket appealing
Mathematics is very intensive and its not easy to appreciate its essence. But then we have a system to train students so that they can understand and appreciate the Maths.
Similarly, Test cricket is very intensive not only for the players but also for the audience. So it is important to train and teach the audience to appreciate Test Matches. Both media and the cricket administrators have an important role to prepare a generation of audience that can understand Test Cricket.
The cricket admin. should not fall for quick money that the shorter form of the game are bringing now. It may not last. Further ICC should expect to see the game spread out in non-cricketing countries in a matter of few years. ICC should realize and accept the fact that cricket grows slowly. Even a country like Bangladesh that has been playing cricket since very long, has failed to produce a good side so far. It takes at least two generations of players to establish a culture for the game than can generate cricket player that can shine at international level.
The media should not favor one form of the game over other, just because one form (Twenty20) is likely to bring more money. Good things in life go beyond money. The test match telecast on the TV should be informative to the audience and should go deeper than just showing the match. There should be a way to bring out the process that goes in the preparation of the Test Match. The so called highlights should not just contain the boundary shots and wickets. Certain singles and defensive shots are sometime more critical than boundaries. Further, the former players, together with the media, should make an effort to bring out the psychological aspect of the game.
Once we have an audience that can understand the game, no form of Cricket would fall short of audience.
Do we need test cricket
Opinion will divide on this question. Those of us who understand the subtleties of the game would very like to see the Test Cricket to live on. Those who think that action in cricket means 6's or 4's would like to see Test cricket make way for the shorter and more action-packed forms.
However, anyone who cares a bit about cricket would not want to see the greats of WG Grace, Jack Hobbs, Don Bradman, Gary Sobers, Sunny Gavaskar to go into obscurity. For that it is important that we teach the public how to appreciate cricket.
Here I would like to sound a warning that all forms of cricket feed on Test Cricket. If we do not have players of Test Match quality, we will not have good consistent players in the shorter forms of the game. Notice that it is the consistent players who eventually become HEROES. A game that cannot produce heroes will soon fall out of the public imagination.
Monday, June 22, 2009
Over by Over Bowling analysis of T20 Cricket World Cup
In this post I will analyze the over-by-over performance of the bowlers in terms of runs conceded and wickets taken, in the just concluded T20 world-cup.
In the figure below blue traces are for First inning, and red colors for the second inning. Just before the end of the first power play average runs increase followed by a relatively calm period from 6-15 overs. In last 5 over average run rates tend to increase (expectedly). There is a very interesting difference between the first inning and second inning in terms of average runs. In first inning there are significantly more runs scored in 16-17th overs. This indicates that on average the team batting first should win. When I checked this, I found that in first 18 matches, 9 teams won while batting first. But very surprisingly, in last 9 matches of the tournament, seven times the team batting first won.

The probability of fall of a wicket steadily increased as the matche progressed. Again in second inning there was a significantly greater chance of fall of a wicket in 3rd and 9th over.
Previously I found that in Indian Premier League average runs per over were very strongly correlated with the probability of a wicket in that over and in subsequent over.
The Essence of Good Bowlers -- Twenty20 Cricket WC Bowling Analysis
In this post I will analyze the performance of various bowlers in the just concluded Men's Twenty20 Cricket World Cup.
Ananth reported that in Indian Premier League 2009, it did not matter who the bowlers were. Part-timers performed just the same as the regular bowlers on average.
Being an bowler myself, I could not imagine how could a part-time bowler perform be considered same as a professional bowler. Does it mean that there is nothing in toiling for years to perfect deliveries. At the moment all factors indicate that T20 will become the format of choice for furture. But if the quality of a bowler is not relevant in this form of cricket, in all possibility the art of quality bowling would dies and there wont be any Ashes for the bowlers.
It is clear that there is a big difference between Glenn McGrath and say Ashish Nehra when we compare them in Test or limited over cricket matches. In this post I will try to identify the differences between specialist bowlers and part-timers.
Data
I took the bowling data from cricket.org. I extracted runs conceded and wickets taken by a bowler. Subsequently I divided all the bowlers used in the T20 world-cup in four groups according to the number of overs each bowler bowled. The four groups consists of bowlers who bowled (1) 1-5 overs (red), (2) 6-12 overs (orange) (3) 13-21 overs (pale blue) (4) 22-28 overs (blue). It is possible that some regular bowlers ended up in the 6-12 over group because their team made an early exist. I did not correct for this. However, in principle we can compare the performance of bowlers with 1-5 over with rest of the bowlers.
Hypothesis
Very naively I hypothesize (and you will agree with that) that a good bowler is more likely to bowl a good over and a bad over is a less likely event. On the other hand a part-time bowler is equally likely to bowl a good over and bad over. These differences may not be captured by average economy rate or strike rate of the bowlers, because the distribution of runs-per-over and wickets-per-over are likely to be skewed for specialist bowlers and, symmetric and wide for part-time bowlers.
Bowling performance distribution
In panel A below I show the mean economy rate of the bowlers in four different groups. The average values are indeed different but the standard deviation is too big and the differences are not significant. Similarly in panel B I show the probability of a wicket. Once again the group-4 is likely to take more wickets but the standard deviation is rather high and differences with respect to the first group (part-timers) are not significant.
So panels A and B show that first and second order moment (mean and standard deviation) of the wickets and run distribution are not informative in differentiating the quality of various bowlers.
A detailed look at the data in terms of the full distribution give a complete picture. In panel D I plotted the distribution of runs given in over by specialist bowlers (blue) and part-times (red). Now the differences are much more stark.
This figure also provides support for my hypothesis that a good bowler is more likely to bowl a good over than a bad one, and the distribution of the specialists is skewed with a fat-tail. As the quality of the bowlers declines (as indicated by their use in the tournament), the distribution becomes symmetric and broader such that bowers who bowed 1-5 overs are equally likely to bowl an maiden over and an over with 16 runs.

The differences between the distributions of the specialists and part-times bowlers' economy rate is very satisfying not just because it supports my hypothesis, but also because it gives a more quantitative way to differentiate the quality of bowlers.
There are sophisticated tools to differentiate distributions shown in panel D, but at the moment I have too few data. Later when I will have a bigger database I will be able to put numbers on quality of bowlers.
Cricket.org only recently has started to put the commentary of full matches, else it would have been indeed possible to provide a quantitative difference between Ashish Nehra and Glenn McGrath beyond the averages.
right arm over
Arvind
Thursday, June 18, 2009
Why Garry Sobers is better than Jacque Kallis -- Analysis of Test Cricketers
In my previous post I gave hints how one can estimate the quality of a player as a batsman, bowler or all-rounder. The idea is rather straightforward. Good batsmen will increase their cumulative runs at a much faster pace as a function of matches played, while bowler will increase their cumulative wickets at much faster pace.
The Criterion
So I looked into the data of about 400 players, for their total runs and wickets over their career. The plot is shown below. In panels A runs are plotted as a function of matches played. It turns out that the top 20% batsmen in the history of test cricket increased their runs at nearly 72 runs per match. Top 20% bowlers on the other hand increased their runs at about 10 runs per match.
Similar trend is bowling data, where top 20% bowlers increase their wickets at 4.73 per match.
So 72 runs per match and 4.7 wickets is a criteria to be a good bowler or batsman, respectively.


What is an all-rounder
These two numbers (72 for batting and 4.7 for bowling) also can allow us to suggest how close someone is close to be a good bowler and batsman simultaneously i.e. all-rounder.
How do we check whether a player has been a more of a bowler or a batsman or both. In fact, by following careers of some players, like Steve Waugh who was considered as an all-rounder in his early days but ended his career as a batsman. Similarly Ravi Shastri. That is a player with good abilities with bat and ball, can switch roles very dynamically.
So I thought to see the runs per match (run slope) and wickets per match (wicket slope), over a period of 10 matches. This window of 10 matches was slided by 3 matches to get another estimate. The sliding can also be done with 5 matches as many Test series are of that length, but then I consider the fact that an allrounder may not play full series due to injuries or such factors.
With a window 10 matches which was slided by 3 matches, I calculated the run-slope and wicket-slope of 28 players. Average run-slope and average wicket-slope are plotted across each other. The players name is indicated in the figure.
It is clear that Brian Lara, Ricky Ponting, Rahul Dravid, Sachin Tendulkar are right on the top, together with Sunny Gavaskar. This kind of plot also reveal similarity between Viv Richards, Alan Border and Javed Miandad.
On the bowling side, that is in left-bottom corner, all usual suspects (Glen McGrath,Ambrose, Warne, Murali) are placed.
Now the allrounders are in the middle of this plot, the likes of Imaran, Kapil, Botham, Daniel Vettori, Flintoff. I also added Vinno Mankad and Keith Miller to get a historical perspective.
So indeed the good allrounders are those who maintain a good run-slope and wicket slope.
What wait, what about Gary Sobers and Jacque Kallis?

The curious case of Sobers and Kallis
In figure above Gary Sobers is placed slightly higher than Jacque Kallis. Both are great players and simple analysis indicates that Kallis is slightly better than Sobers. But in the figure above, subtle differences are accounted for and we see that Sobers was slightly better, both as a bowler and a batsman.
To get a detailed look on this, I plotted the progression their cumulative wickets and cumulative runs in figure below. The red trace(Sobers) in both panels (A,B) is above Kallis (blue trace).
Panels C and D show the run-slope and wicket slope for both in 10 match segments. An interesting picture emerges. Sobers leads Kallis on batting scale very early. Actually its the inning of 365 runs that gave Sobers an early surge in run-slope. Kallis was a bit slow in scoring runs early on. Both players did good with ball only in their mid-career i.e. around 40-60th matches and that improved their image as all-rounders.


From panels C and D in figure above we can safely conclude that in their mid-career both Kallis and Sobers were highly comparable, in fact, tended to be more like bowling all-rounders . Sobers started to be more of a bowler towards the end of his career as see by dip in red trace in panel D. Kallis is having a very good time with bat but struggling with ball of late.
In general both Sobers and Kallis more or less all the time were in top 20% batter group, but only occasionally made it to 20% bowlers.
These dynamic changes in the nature of performances over short periods of 10 matches in case of Kallis and Sobers prompted me to do make similar figures for Ian Botham, Imran Khan, Kapil Dev and Richard Hadlee.
In the beginning of their respective career the four celebrated all-rounders were more or less alike, but then around 50th match Richard Hadlee outperforms his compatriots in batting!!. Just like the beginning all four all-rounders had similar decline in their batting and bowling towards the end. Kapil Dev observed a slower decline, which perhaps is the reason of his longevity.
Again these four all-rounders were nearly always in top 20% bowlers but only occasionally in top 20% batsmen.

From an all-rounder to batsmen
Further, I wanted to look at the career progression of Steve Waugh, Ravi Shastri and Sanath Jayasuriya. Steve Waugh was regarded as an all-rounder in the beginning. The analysis show that he had a start like that of Kallis and Sobers but he was far from the class of Imran/Botham/Kapil. His decline as a bowler and rise as a batsman is clearly visible in the red traces in panels C,D below. Towards the end he was a batsman, but you don't need to to bowl when Glen McGrath and Shane Warne are on your side.
Similarly Ravi Shastri was a bowler of about average class in the beginning and ended as an average batsman and a poor bowler.
Sanath Jayasuriya has interesting spell in his career when he was a good bowler, or a good batsman or both. Around the time of his 50th test match he was in the class of Sobers/Kallis, currently he is just a good batsmen. They way he is showing no signs of retirement, who know he may again return to his all-roudner status for a short time.

In all I think estimation of run-slope and wicket-slope in short duration is a very good indicator of the abilities of a player as an allrounder or batsman or a bowler.
This analysis reveals that the four celebrated all rounders (Kapil/Imran/Botham/Hadlee) were in fact more bowlers who were very effective with bat. On the other hand Sobers and Kallis are more of batsmen who are really good with ball.
right arm over
Arvie
PS: In the plots above I should have added the error-bars but I just wanted to keep the figures uncluttered, but if someone needs I can provide those.
Tuesday, June 9, 2009
Criterion to classify a player as a bowler, batsman or allrounder in Test Cricket
I once again took data from 's blog where he is analyzing the runs and wickets from the Test players to identify player with best allrounder abilities (in terms of making runs and taking wickets).
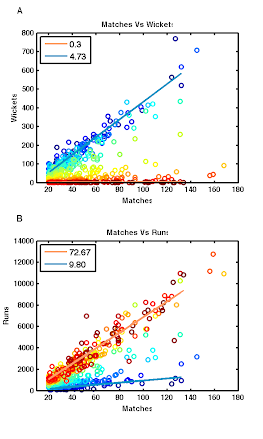
He admits that there is some kind of arbitrariness in dividing the data in separate groups. There is more or less a continuum in the batting and bowling record of various test cricket players, as can be seen in the scatter plot shown below. In the figure below I plotted the runs scored by a player versus wickets take by that player. The color of the dots is the allrounder index defined by Anantha. Dark blue colors show low index (more bowler) and red-brown colors show larger index (more batsmen).
 Here I propose an additional criterion to cluster the player in bowler or batsman group or in between (all rounder).
I hypothesize that bowlers are the ones who consistently increase their total wickets as a function of matches played as a greater pace than non-bowlers. The speed by which a player increases his total wickets can be captured by the slope of matches vs wickets curve. The slope will be highest for pure-bowlers group and smallest for pure-batsmen group. Similarly, the slope of matches versus total runs slope can be estimated to define a criterion to qualify a player as a batsman. The logic is same that pure batsmen tend to increase their aggregate runs as a faster rate than lesser batsmen. An all rounder candidate should obviously increase both runs and wickets with matches.
In panel A of the figure below, I plotted the number of wickets taken by various players as a function of number of matches they played. The color of the circles is defined by the player index (defined by Annanth), blue shades indicate low index and red shades mean a high index. Further I identified top 20% % bowlers (i.e. the players coded in blue shades) as defined by Ananth's criterion and fitted a line (blue) to those. The line has a slope of 4.73. Similarly, I identified top 20% batsmen (i.e. those with high player index -- red shaped) and fitted a line (orange) to estimate the slope of wickets as a function of matches. The 20% batsmen have a slope of 0.3.
In the same vein, in panel B I plotted total runs scored with respect to matches played. Color-code for the circles is same as in panel A. Again I fitted straight lines through top batsmen and top bowlers. The batsmen tend to increase their aggregate runs with a slope of 72.67, while the top bowler increase their aggregate with a slope of 9.8. These two number could match with the average of average runs scored by batsmen and bowlers respectively.
These four slopes 4.73 and 0.3 (bowler criterion) and 72.67 and 9.8 (batsmen criterion) set the boundries to classify a player as bowler or batman or both.
We can study the developement of number of wickets and aggregate runs of a player as a function of matches played by him and the two slope (runs vs matches and wickets vs matches) will render him on some location in the two panels and would provide a more objective criterion to decide whether a player is more a bowler or a batsman or a candidate to be both.

In coming few I will analyze the pregression of Gary Sobers, Jacque Kallis, Imran Khan, Sid Barnes, Kapil Dev and Ian Botham to see where they fall in the above two plots.
right arm over
Arvind
Friday, June 5, 2009
T20 International -- Over by Over Correlations
Following my previous analysis of correlation analysis of over by over runs and wickets I provide further details on the correlation structure of the runs and wickets I estimated the cross-correlograms.
A cross-correlogram estimates the correlation between one variable and other variable considered at different shifts. When we calculate the correlation between Run from over 1-20 and Wickets from 1-20, it is correlation between the two variables (runs and wickets) at zero lag. We can also do the same calculation for Runs from overs 1-19 and wickets from 2-20 overs. This will be correlation for +1 lag. Similarly one can do it for all positive and negative lags. Physical meaning of the correlogram is following.
If we find a peak in correlogram at a different lag than zero, it means that one variable preditcs another at some point in future. For instance, in panel A of figure below, the red trace peaks at -1, it means that if there is high scoring in an over there is 20% chance of fall of a wicket in the following over. In the figure above I show cross-correlograms between Runs and Wickets per over (Panel A) for both first (blue) and second (red) innings. The light-blue and pink lines show the shuffled correlations i.e. provide a way to calculate the significance of the correlations. Similarly in panel (B) crosscorrelogram is shown for Avg. runs and Av. wickets per over.
It is interesting that the in second inning a high scoring over is likely to lead to a fall of wicket in the following over. This dependence is more evident in averages. On average high runs in an over would lead to fall of wicket in next over in 40% chances and 60-70% in the very same over.
I wonder if this the case in general of a feature of only the shortest form of the game. My guess is that in Test Cricket there should be no correlation between runs and wickets but in 50 over matches it should exist, particularly in slog overs.
Further, there is something more interesting in the auto-correlogram function of the Wickets. Auto-correlogram is same as the cross-correlogram, except that now instead of two different variable, we cosider only one variable. The secondary peaks in the auto-correlation function indicate oscillation i.e. repeating phenomenon.
The auto-correlogram of Wickets per over shows some periodicity of 3 overs but only in the second inning. This means that in second inning of the T20 international matches wickets are likely to fall at 3 over interval. Needs to be checked in raw data...

right arm over
Arvie
A cross-correlogram estimates the correlation between one variable and other variable considered at different shifts. When we calculate the correlation between Run from over 1-20 and Wickets from 1-20, it is correlation between the two variables (runs and wickets) at zero lag. We can also do the same calculation for Runs from overs 1-19 and wickets from 2-20 overs. This will be correlation for +1 lag. Similarly one can do it for all positive and negative lags. Physical meaning of the correlogram is following.
If we find a peak in correlogram at a different lag than zero, it means that one variable preditcs another at some point in future. For instance, in panel A of figure below, the red trace peaks at -1, it means that if there is high scoring in an over there is 20% chance of fall of a wicket in the following over. In the figure above I show cross-correlograms between Runs and Wickets per over (Panel A) for both first (blue) and second (red) innings. The light-blue and pink lines show the shuffled correlations i.e. provide a way to calculate the significance of the correlations. Similarly in panel (B) crosscorrelogram is shown for Avg. runs and Av. wickets per over.

It is interesting that the in second inning a high scoring over is likely to lead to a fall of wicket in the following over. This dependence is more evident in averages. On average high runs in an over would lead to fall of wicket in next over in 40% chances and 60-70% in the very same over.
I wonder if this the case in general of a feature of only the shortest form of the game. My guess is that in Test Cricket there should be no correlation between runs and wickets but in 50 over matches it should exist, particularly in slog overs.
Further, there is something more interesting in the auto-correlogram function of the Wickets. Auto-correlogram is same as the cross-correlogram, except that now instead of two different variable, we cosider only one variable. The secondary peaks in the auto-correlation function indicate oscillation i.e. repeating phenomenon.
The auto-correlogram of Wickets per over shows some periodicity of 3 overs but only in the second inning. This means that in second inning of the T20 international matches wickets are likely to fall at 3 over interval. Needs to be checked in raw data...

right arm over
Arvie
Thursday, June 4, 2009
T20 Cricket - Correlation Between Avg. Runs and Wickets per over
Once again Annant did an amazing job of analyzing the T20 international matches.
Like previous time I decided to estimate the cross-correlation between average runs scored in an over and average wickets per over.
The figure below shows color coded correlations between Runs, Average Runs, Wickets and Average Wickets per over. In panel A correlation are shown for the first inning and in panel B correlations are shown for the second inning. Only significant correlations are shown in the colors. For more visual impression in panel C shows total runs versus total wickets in any given over (blue - Ist inning, red - IInd inning). Similarly, panel D shows average runs versus average wickets. The corresponding correlation boxes for panels C and D are also morked with C and in panels A and B.
There are two observations
1) Runs scored in any over is strongly and positively (0.7 in first inning and 0.57 in second inning) correlated with probability of a wicket in that over. This is similar to what I showed for the IPL2009.
2) The Runs scored and Wickets fallen are far more related in the first inning (0.7) than in the second inning (0.57). Any suggestions why one would expect that?
 Right arm over
Arvind
Subscribe to:
Posts (Atom)